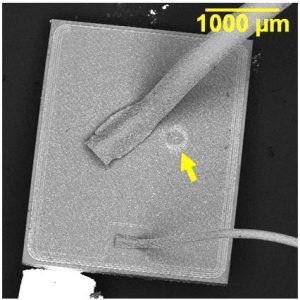
FET 2 1909

This is a SE SEM image of the device die. The source bond wire (left) was fused open. The gate bond wire (right) was intact.

FET 1 1909

This is the source bond pad. This material (arrow) is fused gold-copper-silica-silicon.

The source bond wire is fused open suggesting excessive source current caused the failure.

Check out SEM Lab, Inc.  to learn more.

Diode fail 1868

This diode failed due to electrical overstress, likely reverse biasing greater than 1000V. The die fractured when it was de-processed. The melt-through site is indicated by the arrow. Quality issues may have been a factor including post and die attach solder voids, and potting voids, which would be expected to impact the maximum power capability of the diode causing it to fail at lower than rated conditions.

Check out SEM Lab, Inc.  to learn more.

Ta breakdown 0

This is a BSE SEM image of the microsection of the tantalum capacitor.

Ta breakdown 1

The breakdown site is indicated by the arrow and is associated with the edge of the slug near the lead attachment at the cathode.

Ta breakdown 2

This is an EDS dot map that shows the amount of alloying and inter- diffusion associated with the failure event.

Check out SEM Lab, Inc.  to learn more.

Internal PWB Short

This is a BSE SEM image of a parallel microsection showing an electrical breakdown site on an inner laminate layer of the PWB. The short developed due to copper electromigration through damaged areas of laminate from a previous operation where excessively warped boards were laminated to heat sinks.

Check out SEM Lab, Inc.  to learn more.

hexfet 1

Optical image of HEXFET® Power MOSFET.

Breakdown site is located near the source wire bond.

The breakdown site is located near the source wire bond.

hexfet 3

This is a higher magnification image of the breakdown site.

The breakdown current in amperes can be roughly estimated by the radius of the “hot spot” or breakdown site [1]. The breakdown current is estimated at ~ 1 amp/1 mil radius.

[1] J. T. May, “Limiting Phenomena in Power Transistors and the Interpretation of EOS Damage”, in Microelectronics Failure Analysis Desk Reference, 3rd Edition, ASM International Press, 1993, pp. 321-328.

Check out SEM Lab, Inc.  to learn more.

BPS 1

BSE SEM image of BGA microsection.

BPS 2

The entire interface fractured between the Ni-Sn intermetallic layer and the Ni-P of the ENIG board pad. This is the corner ball where warpage strains are at maximum typically.

BPS 3

Evidence of “hyper-etching” of the Ni-P grain boundaries, which is a symptom of black-pad-syndrome.


This is a recent example of “hyper-etching” of the Ni-P grain boundaries on an ENIG finished PWB that could be described as moderate relative to the previous example.  This is the fracture surface of the PWB pad where a BGA was sheared off in what we refer to as “pry & SEM” evaluation.  The phosphorus concentration at the fracture surface was determined to be 17.4 wt%, which is elevated compared with the expected 7 – 9 wt% phosphorus for medium phosphorus electroless-nickel.  The elevated phosphorus and brittle fracture at the Ni-P/Ni3Sn4 interface are consistent with black pad syndrome, though this appeared to be a marginal case.

Check out SEM Lab, Inc.  to learn more.